


If you know what happened to humpty dumpy this title needs no introduction. If you need a refresher. I am alluding to is the market going to fall off and be broken or can it stand its ground and recover.
—————————————————————-
One thought that’s been resonating with me lately is no one wants to talk/work/research during a bear market. People are walking away and shutting their eyes. The hard part for most is putting in the work when things are toughest.
These are the times to do the talking, to invest in yourself and start to lay your bricks. It is how you build for the future.
—————————————————————-
Here is the Wednesday run down…….
The weekly bitcoin to large cap alts chart comparison
BTC is now only a few percentage points away from the last time it hit $5700
Short term bulls need to defend $6100-$6300 and from a macro perspective that $5700 price point should make or break this market.
Alts are congested at a bottom and they have given back all their summer gains.
We could see one last capitulation day where we see an extreme amount of selling followed by an extreme amount of buying. This is where weak hands get washed out.
—————————————————————-
Now we’ll look at the DAILY CHARTS to zoom out of the most recent volatility and get a bigger picture view.
—————————————————————-
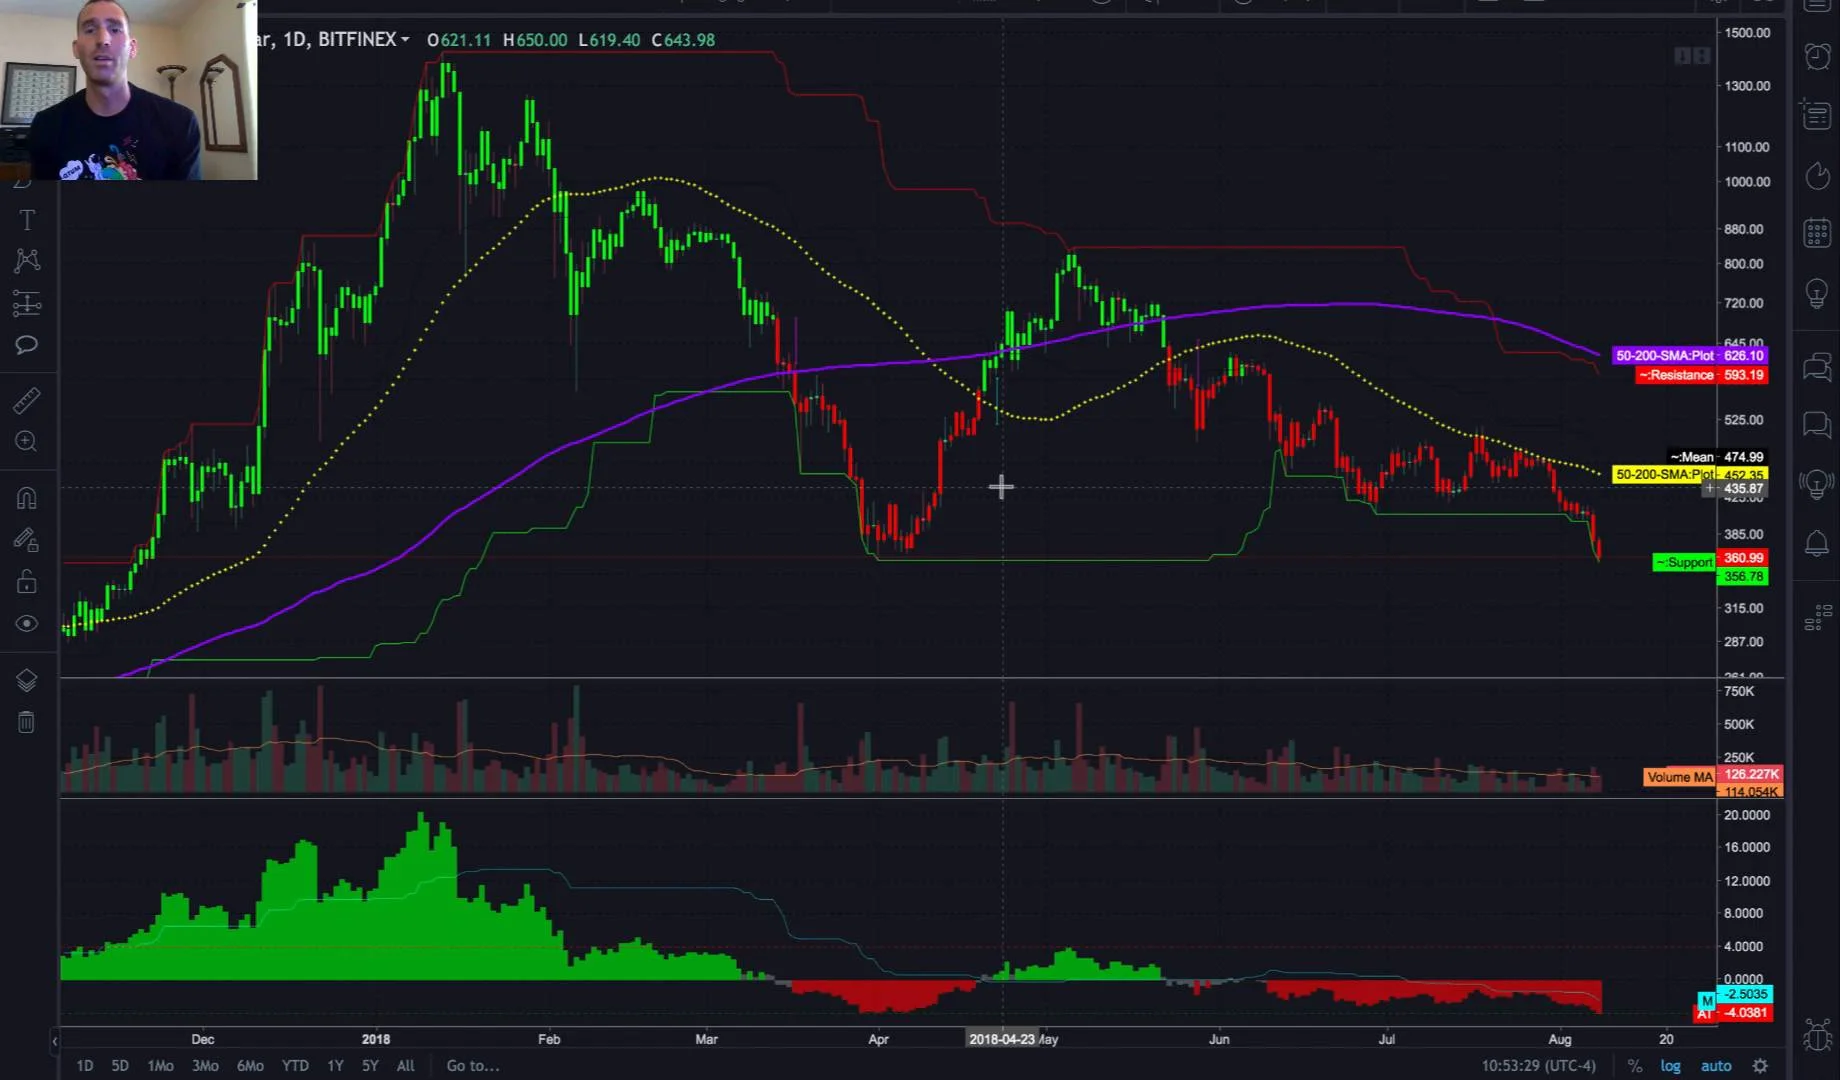
BITCOIN:
Short/Intermediate/Long term support has held this level nicely. If you look at the chart it is a place of support. Until it is violated it is the most important price point. I’ve said it for many weeks now and I still stand by this thought process.
Trading below the 50 and 200 which means it is in the bearish phase.
Past 10 out of 11 trading days price has closed down.
RSI which measures overbought and oversold levels –
(OB = <70) (OS = >30).
Most amount of volume in 2018 has occurred at $8200 price level
—————————————————————-
ETHEREUM:
Large descending triangle from the top in early January to now.
Price needs to hold $350
Price over last several months ETH has slowly been dropping over time where the run up happened on big moves. Since May price has been stair stepping down with a decrease in momentum and volatility. If ETH breaks this $350 level $290-$310 are its next levels.
—————————————————————-
XRP
Broke its most recent support at 54000 SATS and made a new low since breaking out during the 2nd week of December. Next levels of support include 46300 which is where I’ll start making laddered buys.
Look for my article next week on XRP and its relation to Ripple and what I think about it from the fundamental side of things.
—————————————————————-
XMR
Has made a new low in price and if it breaks the 157000 SAT price it looks like 130000 SATS will be its next testing grounds. Should this reach a level of 110000 SATS is where I would be a long term buyer and start laddering into a deeper position. XMR is one of part of my long term crypto portfolio.
—————————————————————-
Any questions feel free to let me know!
-Mark